CFB Update: One Month In
Posted on September 22, 2024 at 11:40 AM
It’s been 27 days since I launched my college football model, and we've seen four weeks of games in that time. Now seems like a good moment to take a step back, evaluate its performance, and share some key updates, as I’ve made several changes that fundamentally alter how the model operates.
Model Performance
Overall, I’m quite pleased with the model’s performance so far. It has correctly predicted 229 game outcomes, while being wrong on 59 occasions, yielding an accuracy rate of 81.7%. Among those 59 incorrect predictions, 26 were what I’d classify as "toss-ups," where the model gave the winning team less than a 60% chance of victory. The other 33 were "confidently wrong" predictions—an unavoidable part of predicting football, which is rife with randomness.
One factor contributing to the incorrect predictions is that the model still incorporates data from last season. Technically, the baseline offensive and defensive abilities of each team are modeled as a Gaussian random walk, starting from last season's performance but allowing for changes as new data is gathered. The key phrase is “new data is gathered,” meaning the model needs a few weeks of games before it can confidently "override" last season’s abilities.
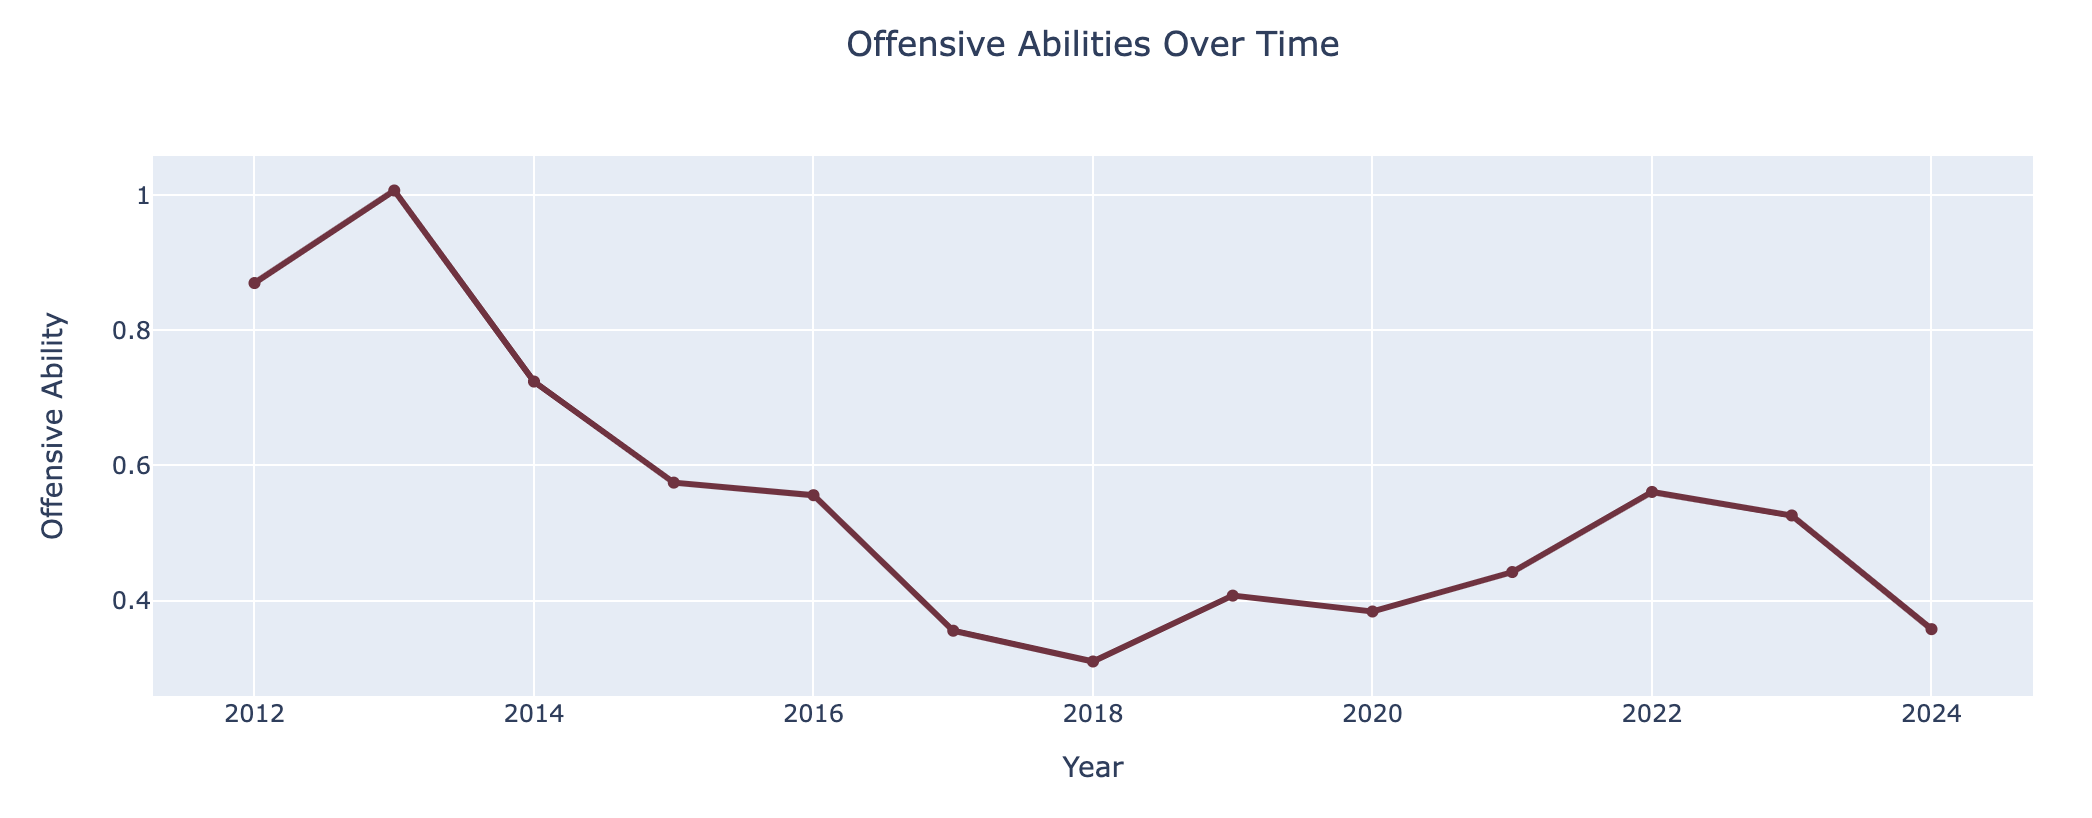
You can see this play out with teams like Florida State, who had a strong 2023 season but are off to a 1-3 start this year. The model initially assumes they’re the same team as last year, giving them the benefit of the doubt. However, it’s now starting to adjust and recognize that FSU's offense is underperforming (as shown on this time analysis page or in the image below). As more data comes in, the model will become better at adjusting for current performance.

Rankings
I’ve launched a couple of new pages in the past month. One that I’m both excited about—and a bit nervous about—is the rankings page. This is where the model has the potential to shine or fail spectacularly. The idea is simple: the model computes offensive and defensive abilities for each team. By combining these scores, we get a total ranking that should give a reasonable sense of who the best teams are.
As mentioned earlier, these rankings are still somewhat dependent on last year’s data until we’ve accumulated enough from this season (which is why FSU is still in the top 25 as of Week 4). However, by the end of the season, the rankings should be a valuable tool based almost entirely on current-year data.
One thing to keep in mind: the model isn't given any actual rankings (like the AP Poll). The fact that there’s a lot of alignment between my model and the AP rankings gives me confidence that it will converge accurately over time.
Time Analysis
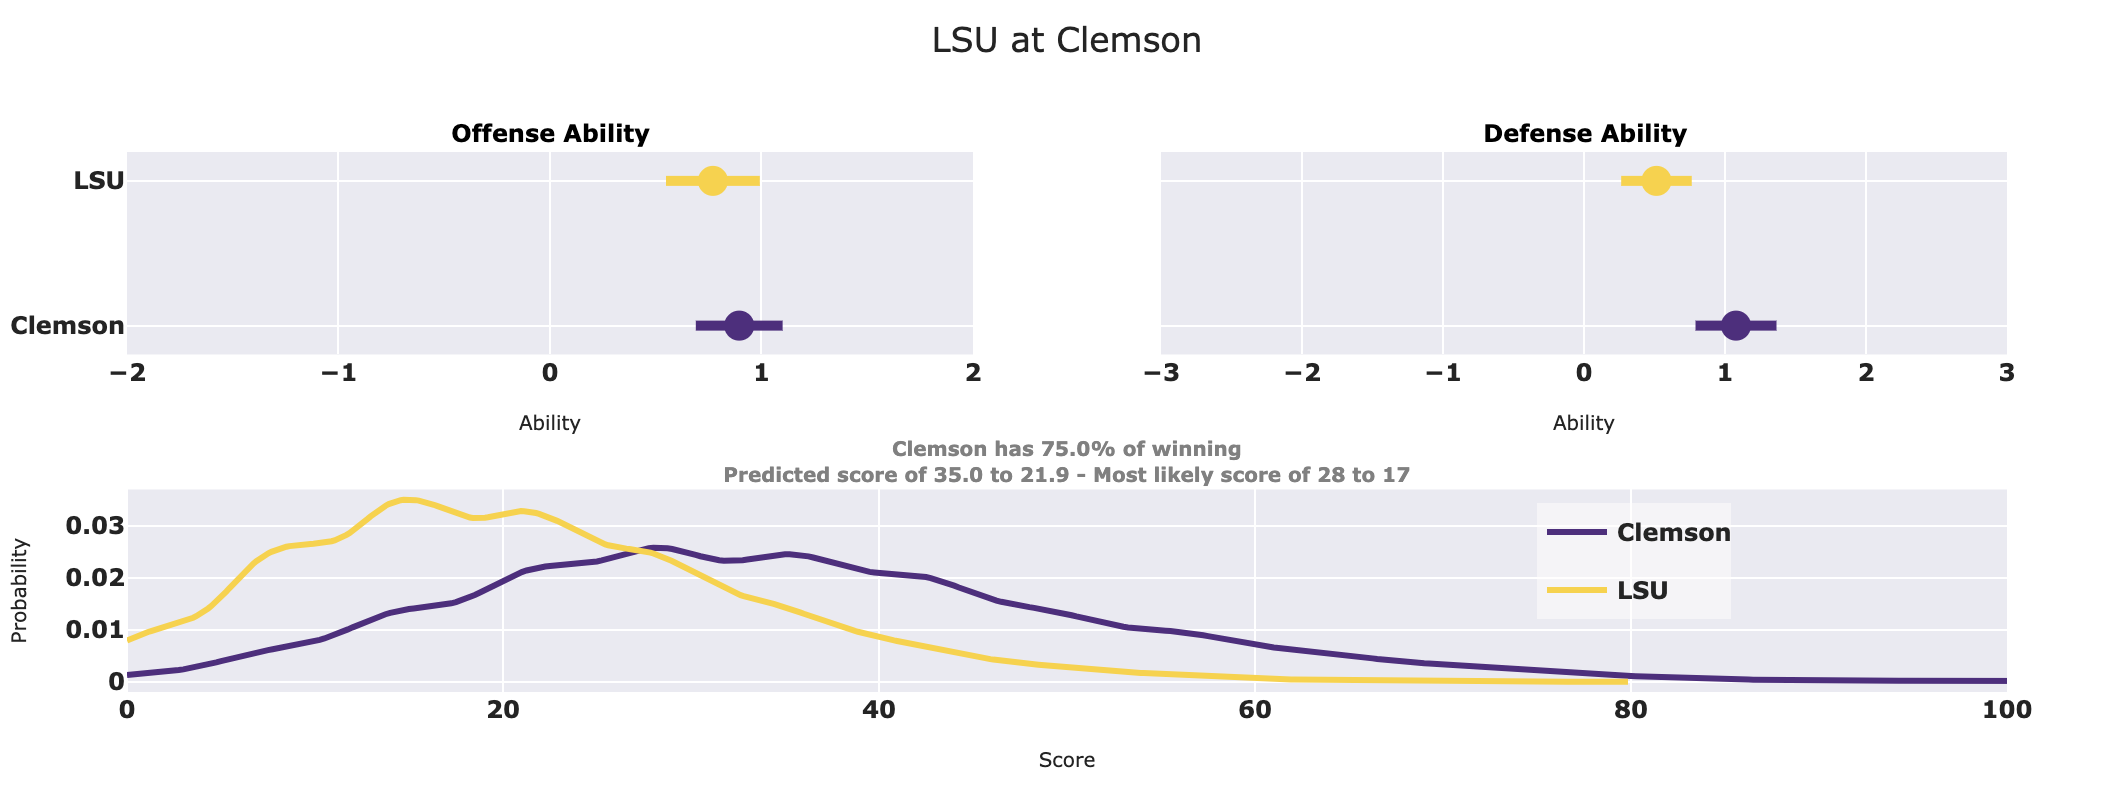
The chart above shows the output of my new time analysis page. The updated model captures team abilities going back to 2012, allowing us to visualize how a team’s offense or defense has evolved over time. This also lets us compare teams across seasons using the game simulator. For example, if you’ve ever wondered “who would win between 2018 Clemson and 2019 LSU,” you can plug it into the simulator to find out (spoiler: Clemson wins comfortably).

After-Quarter Win Probability
Lastly, I’ve added an After-Quarter page, which lets you calculate in-game win probabilities based on the score at the end of each quarter. This model relies entirely on historical scoring data and doesn’t take into account the actual teams playing. You could critique this as a limitation, but sometimes simpler models perform surprisingly well.
Conclusion
Overall, the model is performing well and adapting as more data from this season becomes available. With recent updates like the rankings and time analysis pages, it’s evolving into a more robust tool for understanding team dynamics. I’m excited to see how it continues to improve throughout the rest of the season.
